Cambodia Exports Dashboard
Export statistics dashboard, 2016–2025.
- Role
- Data & front-end
- Context
- GDSME&H · MISTI
- Stack
- Python · pandas · Vercel
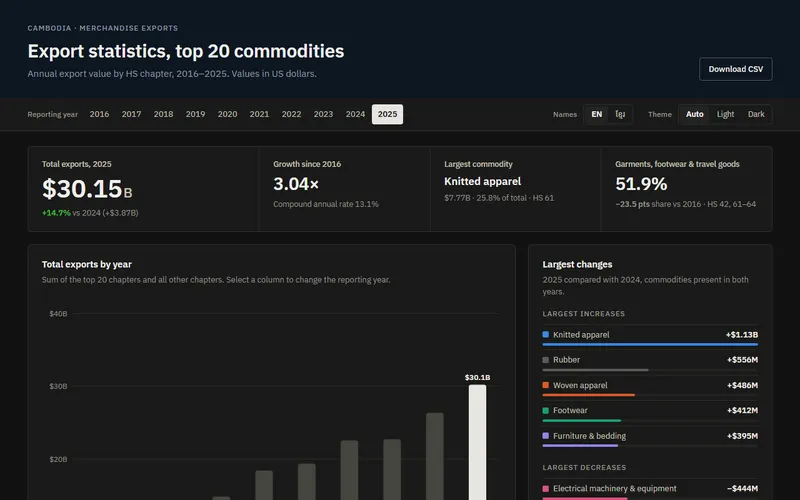
An interactive dashboard that turns ten years of Cambodia’s merchandise export data into a clear story — total exports by year, the leading commodities, and which products grew or shrank the most.
What I did
- 01
Cleaned and combined raw export data from 2016 to 2025, grouped by commodity (HS chapter).
- 02
Wrote a reproducible build script that turns the raw files into the data the dashboard uses.
- 03
Designed the dashboard: headline figures, a year-by-year chart, and the largest increases and decreases.
- 04
Added Khmer and English commodity names, light and dark themes, and CSV download.
- 05
Deployed it as a fast static site on Vercel.
Highlights
Year explorer
Switch the reporting year from 2016 to 2025.
Bilingual
Commodity names in Khmer and English.
Top commodities
The biggest export categories at a glance.
Open data
Download the figures as CSV.